Small Buyout Market Commentary May 2024
Exit Ready?
Exits are the ultimate reward for private equity investors. After a record year in 2021, realizations have been sequentially lower. To be sure, much of this was caused by the pull- forward of exits in the unusually strong 2021. Still, exits in 2023 were below the averages in the several years before the pandemic, indicating a more fundamental exit drought. We and others have analyzed and commented on numerous market factors (e.g., volatile interest rates) that have made the buying and selling of companies more difficult. Today, however, we want to see if there is something beyond the ebbs and flows of the market that could be impairing exits. Is there a more fundamental problem lurking closer to home in our portfolios?
Even in the midst of this bear market for realizations, we hear a common refrain from many GPs: our portfolio or portions of our portfolio are “exit ready.” This is a statement of confidence, but usually muttered in frustration since exits are much more difficult than they should be. What does this mean, and why are we hearing this more often? The inference is that “the market” is the problem rather than quality issues within the portfolio. We wonder if this is true or whether there is a deluded view of company quality or valuations that are just out of step with reality. We want to understand this better, because structural issues within portfolios would make the current exit drought more serious than a mere market disruption. We routinely test company health and valuation integrity on a company-by-company basis through our portfolio review process. However, we wanted to look at our data to see if there are broader characteristics in our current mature portfolios that deviate from expectations in any worrisome way.
To do this, we analyzed our “harvest stage” portfolios to see if their holding periods, rate of realization, and level of returns compare favorably or unfavorably against a much broader average of exited deals. Our control group of “normal” realizations is as follows:
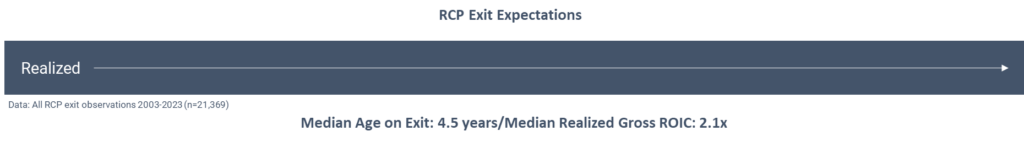
This summarizes exit performance from our data spanning nearly two decades, which includes numerous market cycles. This represents 21,000 realized portfolio investments that we track both inside and outside of our portfolio. The median gross cash-on-cash return of this group was 2.1x, and the median age of the portfolio companies upon exit was 4.5 years.
We then looked at our active “harvest mode” portfolios (those portfolios whose most active investment periods were between 2013 and 2021) to see their progress along the
same realization metrics. We look specifically at these portfolios since they are of an age that should put them squarely in the middle of what we would expect to be an “exit ready” state: realized deals that were exited in recent years and unrealized deals that are maturing. Deals within this sample reflect market conditions spanning from the pre- pandemic years to the slower exit markets that we see now.
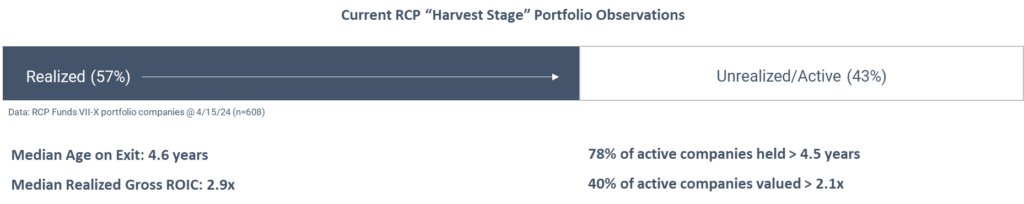
This sample of 608 RCP investments reveals a portfolio that is roughly equal parts realized and unrealized (57%/43%, to be precise).
Of the realized portion of the portfolio, the median cash-on-cash return was 2.9x and the median age of these companies upon exit was 4.6 years. The fact that the ROIC of this sample is higher than the 2.1x in the control sample (while welcome) is not surprising, since we expect that early-to-mid returns will be stronger than those later in life (as well as some RCP selection bias). The 4.6-year median holding period, coincidentally, is nearly equal to the broader control portfolio. However, since these are the early exits in a broader maturing portfolio, we would expect a slightly lower median age. Therefore, this portfolio reflects the gradually lengthening holding period that has been widely reported in private equity portfolios overall in the past several years.
The active, unrealized portion of the portfolio reveals some clues as to health and ultimate performance. Approximately 78% of these unrealized deals (or 33% of the total sample) are held over the 4.5 years that marks the median age of the overall control group. Again, this points toward a gradual lengthening of holding period for this portfolio overall, which is consistent with reports in the broader market. We note, however, that Pitchbook’s median holding period for buyout deals overall is over 6 years, so the shorter expected holding periods in these small buyout portfolios remains relatively attractive, despite the lengthening trend.
We also analyzed the unrealized portion of this sample to look for indications of quality and expected performance. The metric shown above indicates that 40% of the active portfolio (or 17% of the entire portfolio) is currently held above 2.1x (the benchmark in the control sample). When combined with the performance from the 57% of the portfolio that is already realized, this points to overall performance that should be consistent with the longer-term results from the control group. While this information cannot predict ultimate performance, it is helpful in at least eliminating fears of a quality problem that could impair future exit plans.1
This conclusion, however, is only valid if the unrealized holding values (“NAV”) are realistic and not overstated. We and our managers use various methods to set these values in an accurate way. However, the only way to really test the reliability of these values is to compare them to the ultimate value upon exit. Historically, we have observed a meaningful premium of realized value over prior NAV. Over a long period of time, we have observed this “pop” over NAV upon exit to be above 20%. When we analyzed the exits in our sample portfolio, we found a very consistent 20%+ premium over NAV, which indicates a normal and very conservative cushion in valuations. When we dug deeper into this sample, however, we found differences in performance on exits during the COVID period vs. more recent exits, which reveals the significant changes in the exit environment even over the past several years. We found that the median “pop” over NAV for sample deals exited in 2020 and 2021 was 31% and for deals exited in 2022 and 2023 (in the middle of the current exit drought) was 11%. This reveals a conclusion that aligns with our observations and intuition about the changing exit environment: the existence of a “COVID bump” in valuations and activity during the pandemic followed by market disruption and lower volume more recently. Anecdotally, the “pop” metrics on very recent exits (in late 2023 and 2024) indicate a return to more normal (i.e., 20%+) exit value vs. NAV relationships, although the low number of observations don’t yet prove out a trend. While the volatility in this metric reveals the truths of the gyrating exit conditions in recent years, the fact that the value gap has remained positive gives comfort on the inherent condition of the portfolio and for a resumption of exit activity.
Our analysis of our maturing portfolios does little to predict outcomes or predict when exit markets will revive. It does give us comfort, however, that reports of “exit ready” portfolios are not wishful thinking. Although there are signs of slightly longer holding periods, there are few signs of fundamental conditions within the portfolios that should inhibit successful realizations once the market itself improves.